From a marketer’s perspective, one of the big appeals of digital marketing is the ability to track and analyze consumer behavior in real time and exhaustive detail. Modern analytics packages offer an almost overwhelming assortment of data, reports, customizations, and analyses that can reveal powerful insights into site performance, advertising effectiveness, and user tendencies.
Unfortunately, these myriad capabilities often render one unable to see the forest for the trees. Or just plain confused.
Among the uninformed, “hits” is the only number that matters. Remove the word from your vocabulary.
Hits are good fodder for bragging rights but meaningless in and of themselves – it’s like measuring your bookstore’s success just by counting the number of folks who come through the door. If they’re turning right around and leaving, or just hanging out for a while and thumbing through magazines, your bottom line isn’t going to see the slightest benefit.
Katie Paine put it a bit less delicately back in 1997 when she quipped that HITS stands for How Idiots Track Success. Ouch.
Instead, you should focus on the metrics that provide actionable insights on the fundamental, high-level strategic questions you should be asking about all aspects of your business:
- What’s working?
- What’s not?
- What can we do about it?
So what really matters? Below are the three metrics you really need to watch.
[Author’s note: While installing, implementing, and configuring an analytics platform are beyond the scope of this article, I would strongly suggest Google Analytics if you’re not using it already. It’s free, powerful, intuitive, widely used, free, and well supported. Oh, and it’s free.]
Conversions
A conversion is the action you want your site visitors to take when they visit your website. It is, quite literally, the process of converting a visitor from one segment (e.g., shopper) to another (e.g., buyer).
Defining a conversion is pretty straightforward for, say, an ecommerce site: a conversion is an online purchase. For the typical agency website, however, it’s less clear-cut. There are no tangible products. No shopping carts. No checkout processes.
Instead, your site should focus on converting a shopper to a lead. For instance, if you have a “Request a Quote” form on your website (and you should), a submitted quote request is your conversion.
Every analytics platform offers some way to set up conversion tracking (it’s called Goals in Google Analytics and remarkably easy to set up). Here, you can track how many folks are converting on your site and, more importantly, at what rate. Which would you rather have, a site with 5,000 visitors and a 1 percent conversion rate, or a site with 1,000 visitors and a 25 percent conversion rate? [HINT: You want the latter.]
A “good” conversion rate is hard to define, but if yours is down below 1 percent, it’s worth your while to put some thought into why. Is your request form working? Is it easy to find? Easy to complete? Are you attracting the right types of visitors to your site?
- 30-day # of conversions
- 30-day conversion rate
Bounce Rate
As I noted, the customer that walks into your bookstore and walks right out isn’t doing you much good. The same goes for your website. Bounce Rate is the percentage of visitors who come to your site, view a single page, and leave. In other words, it’s the rate at which potential customers “say yuck and leave.”
Again, there is no benchmark for a good bounce rate, but anything over 50 percent is a red flag. Are your pages loading slowly? Are they compatible with all major web browsers? Does each page offer a clear CTA (Call-To-Action, such as “click here to request a quote.)? Does your web advertising accurately reflect the content of your site?
- 30-day overall site bounce rate
- 30-day bounce rate by page
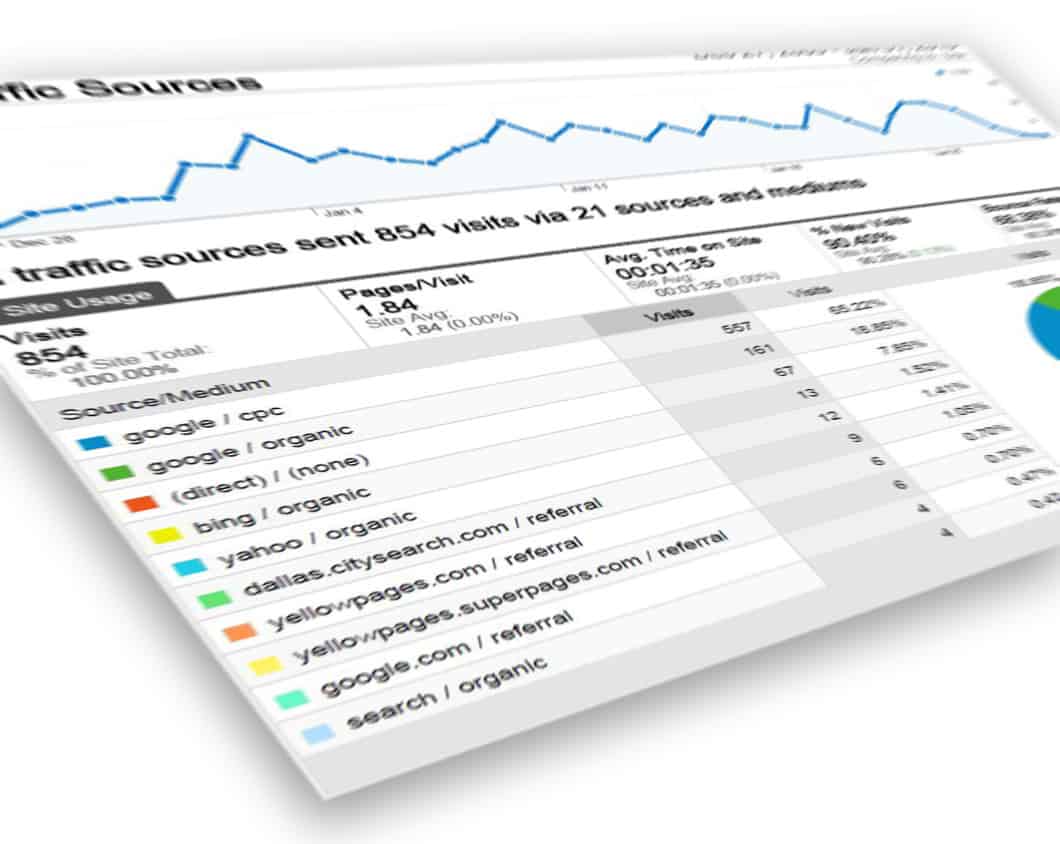
Traffic Sources
In the right hands, web analytics dispel John Wanamaker’s oft-misquoted adage, “Half the money I spend on advertising is wasted; the trouble is I don’t know which half” (see also Seth Godin’s take on the cliché).
A traffic sources report, as the name implies, summarizes traffic metrics by their source. Example sources include:
- Direct – These are visitors who come to your site by entering your URL directly in their browser, or via a browser bookmark.
- Organic Search – Traffic resulting from the unpaid search results on Google, Bing, Yahoo, etc.
- Paid Search – Traffic resulting from a paid search campaign on Google, Bing, Yahoo, etc. Also known as PPC (pay-per-click) and CPC (cost-per-click).
- Referral – Visits resulting from links to your site from other sites, whether they be in the form of a text link or perhaps a banner ad. Depending on your analytics platform and how your banner ad campaigns are configured, referral traffic from paid online ad campaigns might be classified differently.
At the very least, a traffic sources report will tell you exactly how much traffic any given source is driving, but even better is the capability to track the sources of all your conversions. Paying someone a few hundred dollars a month to display your banner ad? Here’s your chance to justify the expense.
Bonus points if you create an Excel spreadsheet with three columns – source, cost, and conversions. Divide the cost by the number of conversions, and you have a useful figure known as CPA (cost-per-acquisition) for each of your traffic sources. Comparing your CPAs by traffic source provides some excellent insight into the relative efficiency and ROI of your online advertising efforts.
- 30-day visitors, new visitors, and conversions by Traffic Source
Actions to Take Now
If your web guru sends you periodic traffic reports, ask for these stats weekly. If you have direct access to your analytics platform, put these in your dashboard.
The 30-day summaries I suggest allow you to keep an eye out for meaningful trends indicating ongoing success or failure. And now that you don’t have to wade through gobs of meaningless data, you can get a good grasp on your site’s performance in just a few minutes.
See a problem? Take action and address it, fast, and watch those three key metrics improve.